FusionTime
Create high-performance time-series visualizations and stock charts in JavaScript (HTML5)
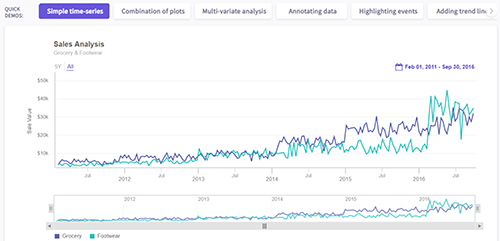
FusionTime helps you visualize time-series and stock data in JavaScript, with just a few lines of code. Whether it’s a simple time-series chart, stock chart, millions of data points in a chart, or even complex multivariate analysis, you can render all of them with the same ease-of-use.
You get out-of-the-box interactivity like time navigator, date range selectors, tooltips with crosslines, interactive legend and much more. In addition, you can plot your data as column, line, area, candlestick, OHLC and even variants like stacked column & area, and overlay them with event and data markers.
And the best part is - the same chart runs across desktop, tablet and mobile, through responsive layouts, on all modern browsers - without any additional effort on your side.